Data Analysis
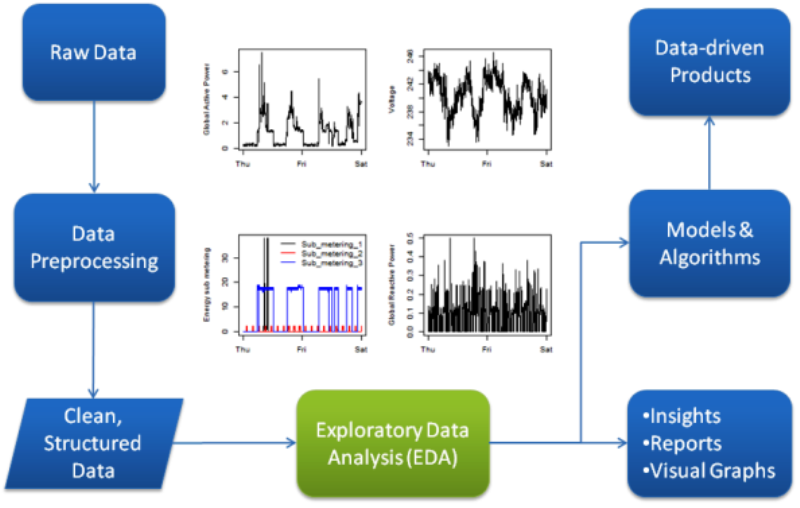
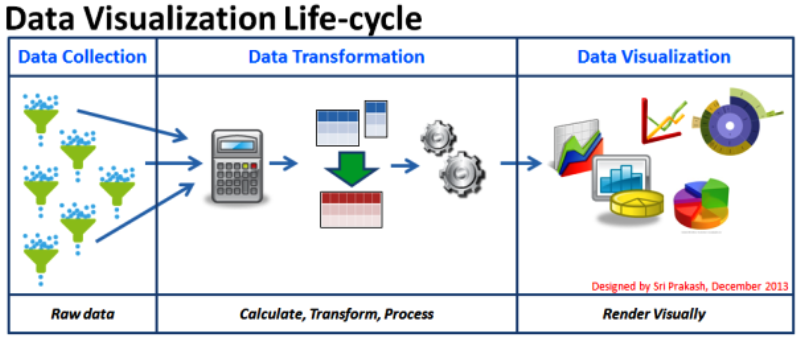
Analysis of data is a process of inspecting, cleaning, transforming, and modeling data with the goal of discovering useful information, suggesting conclusions, and supporting decision-making.
Data Analysis is a lifeline of any business. Whether one wants to arrive at some marketing decisions or new product launch strategy. Data Analysis is the key to all the problems.
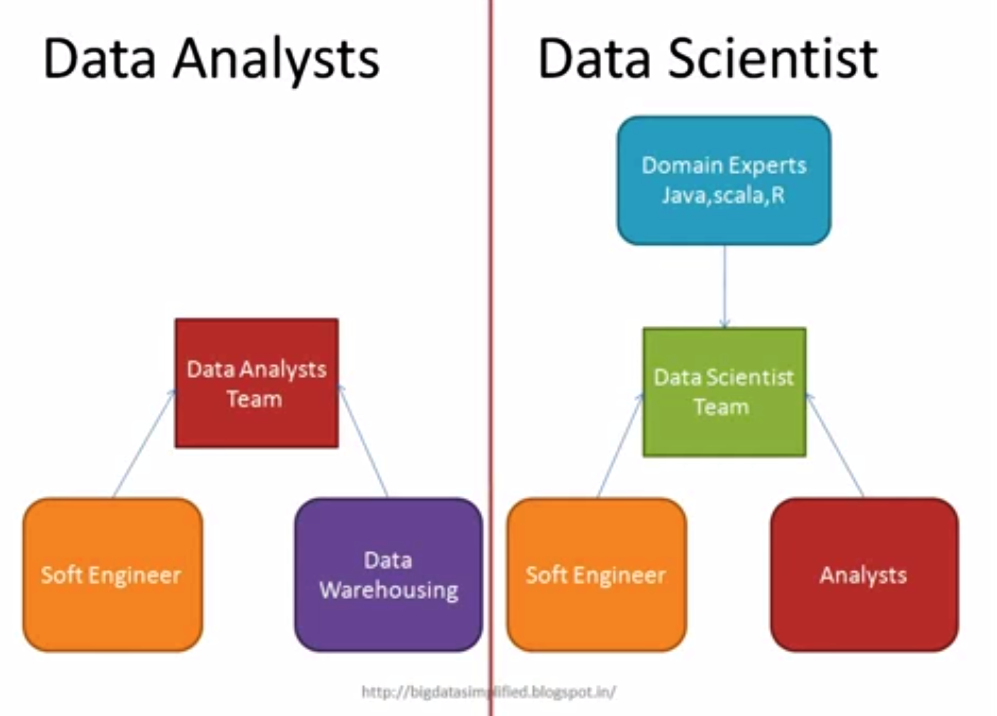
Data analytics professionals are primarily mathematicians, statisticians, database/data warehouse engineers, data miners and IT professionals with data warehousing skills.
Analysis of data is a process of inspecting, cleaning, transforming, and modeling data with the goal of discovering useful information, suggesting conclusions, and supporting decision-making.
- Summarize the main characteristics often with visual methods
- Convert raw data into useful information for decision making.
- Decision supporting system
Data Analysis is a lifeline of any business. Whether one wants to arrive at some marketing decisions or new product launch strategy. Data Analysis is the key to all the problems.
Data analytics professionals are primarily mathematicians, statisticians, database/data warehouse engineers, data miners and IT professionals with data warehousing skills.
|
|
Facts:
- One flight produces 140 TB of Data.
- Google processes 800 TB of data per day.
- Facebook generates 500 TB of data per data.
- A full 90% of all the data in the world has been generated over the last two years.(2013)
- 80% of our Global data is unstructured.
- In 2012, Harvard Business review named Data Scientist the "sexiest job of the 21st century".
- More recently, Glassdoor named it the "Best job of the year" for 2016.
- Facebook users share nearly 2.5 million pieces of content.
- Twitter users tweet nearly 300,000 times.
- Instagram users post nearly 220,000 new photos.
- YouTube users upload 72 hours of new video content.
- Apple users download nearly 50,000 apps.
- Email users send over 200 million messages.
- Amazon generates over $80,000 in online sales.

Data analysis used in Retail, Healthcare, Weather Forecast and Banking
1) Retail
Customer behavior and buying pattern analysis
2) Healthcare
Quality of treatment analysis, Maintaining patient records
3) Banking
Fraud detection
1) Retail
Customer behavior and buying pattern analysis
2) Healthcare
Quality of treatment analysis, Maintaining patient records
3) Banking
Fraud detection
Analytical Customer Relationship Management (CRM) (Retail)
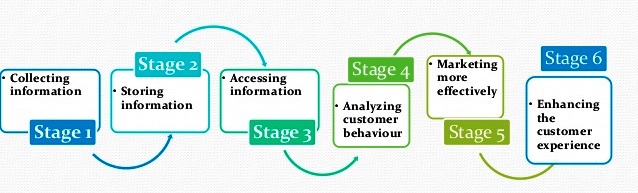
1) The role of analytical CRM systems is to analyse customer data collected through multiple sources, and present it so that business managers can make more informed decisions.
2) Analytical CRM systems use techniques such as data mining, correlation, and pattern recognition to analyse the customer data.
3) These analytics help improve customer service by finding small problems which can be solved, perhaps, by marketing to different parts of a consumer audience differently.
For example, through the analysis of a customer base's buying behaviour, a company might see that this customer base has not been buying a lot of products recently.
After scanning through this data, the company might think to market to this subset of consumers differently, in order to best communicate how this company's products might benefit this group specifically.
After scanning through this data, the company might think to market to this subset of consumers differently, in order to best communicate how this company's products might benefit this group specifically.
|
Advantages of Data Analysis 1) Data Redundancy- No Duplication 2) Data Consistency 3) Data Sharing, Creating forms 4) Data Integration- many tables relation 5) Data Security 6) Data Constraints 7) Data Independence 8) Back up and Recovery |
|
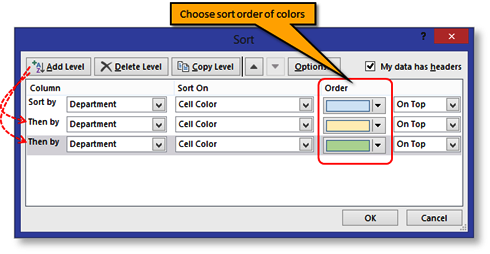
Data Analysis in Microsoft ExcelExcel Sorting Data
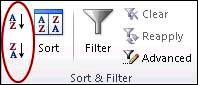
1) Sorting data is an integral part of data analysis. You might want to arrange a list of names in alphabetical order, compile a list of product inventory levels from highest to lowest, or order rows by colors or icons. |
|
2) Sorting data helps you quickly visualize and understand your data better, organize and find the data that you want, and ultimately make more effective decisions.
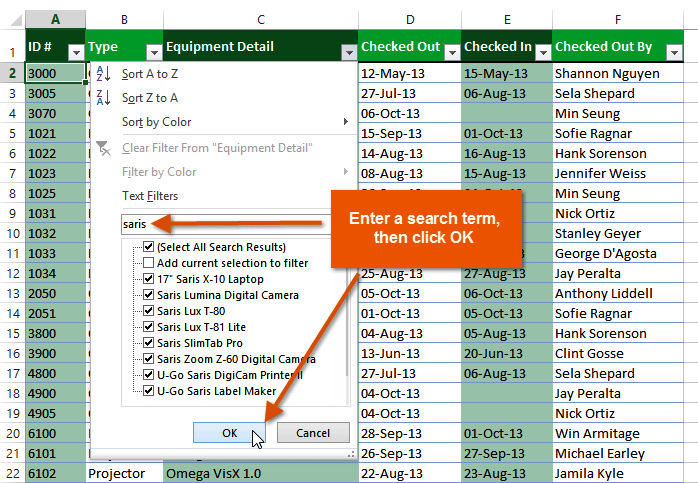
Excel Auto Filter
1) The basic Excel filter (also known as the Excel Autofilter) allows you to view specific rows in an Excel spreadsheet, while hiding the other rows.
2) When a filter is added to the header row of a spreadsheet, a drop-down menu appears in each cell of the header row. This provides you with a number of filter options that can be used to specify which rows of the spreadsheet are to be displayed.
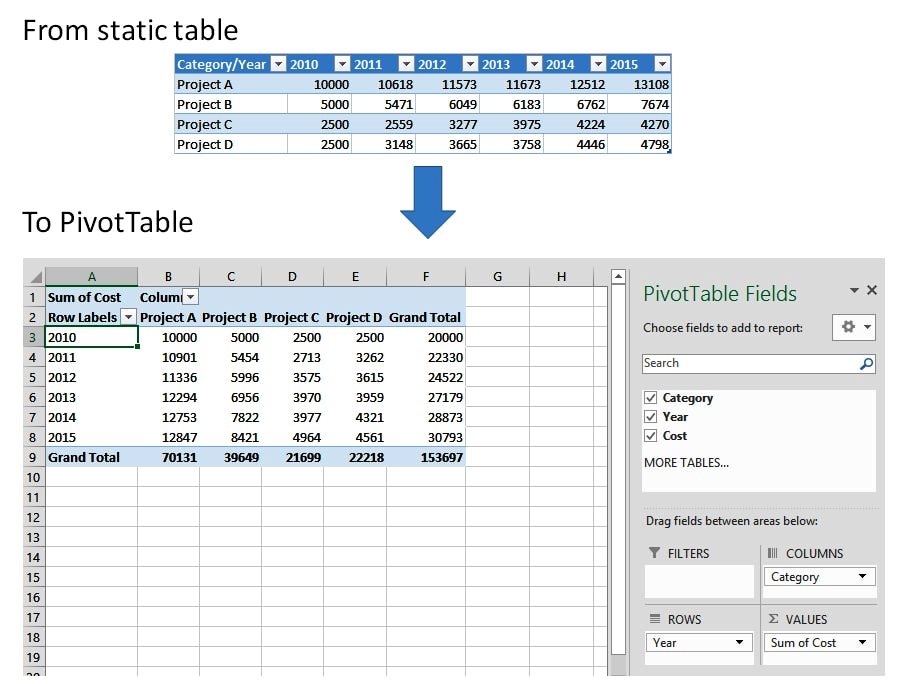
Excel Pivot table
1) A pivot table is a data processing tool used to query, organize and summarize data or information between spreadsheets, tables or databases. Dragging and dropping fields into a pivot table facilitates rotational, or pivotal, structural changes.
2) Among other functions, a pivot table can automatically sort, count, total or give the average of the data stored in one table or spreadsheet, displaying the results in a second table showing the summarized data. Pivot tables are also useful for quickly creating unweighted cross tabulations.(No duplicates)
Power Query
1) Power Query is known as Get & Transform which Power Query provides data discovery, data transformation and enrichment for the desktop to the cloud. (clean data)
2) Power Query enhances self-service business intelligence (BI) for Excel with an intuitive and consistent experience for discovering, combining, and refining data across a wide variety of sources.

Database:- Collection of Data, facts, figures, Tables that can be processed to produce information
Database Model
Data Model: Multiples tables with relationship.
1) A database model is a type of data model that determines the logical structure of a database and fundamentally determines in which manner data can be stored, organized, and manipulated.
2) The most popular example of a database model is the relational model, which uses a table-based format.
3) A data model explicitly determines the structure of data. Typical applications of data models include database models, design of information systems, and enabling exchange of data. Usually data models are specified in a data modeling language.
4) Data models define how the logical structure of a database is modeled. Data models define how data is connected to each other and how they are processed and stored inside the system.
RDBMS ( Structured Data)
1) RDBMS stands for Relational Database Management System.
2) RDBMS is the basis for SQL, and for all modern database systems such as MS SQL Server, IBM DB2, Oracle, MySQL, and Microsoft Access.
3) The data in RDBMS is stored in database objects called tables.
4) A table is a collection of related data entries and it consists of columns and rows
Entity-Relationship Model
Entity-Relationship (ER) Model is based on the notion of real-world entities and relationships among them. While formulating real-world scenario into the database model, the ER Model creates entity set, relationship set, general attributes and constraints.
ER Model is best used for the conceptual design of a database.
ER Model is based on −
-> Entities and their attributes.
-> Relationships among entities.
These concepts are explained below.
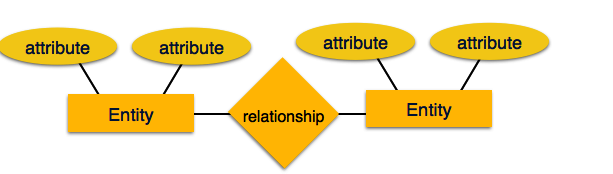
Entity −An entity in an ER Model is a real-world entity having properties called attributes. Every attribute is defined by its set of values called domain.
For example, in a school database, a student is considered as an entity. Student has various attributes like name, age, class, etc.
(Rows-Record, / Columns- Field, Attributes)
Relationship –The logical association among entities is called relationship. Relationships are mapped with entities in various ways. Mapping cardinalities define the number of association between two entities.
(Table- Relation) (One entire row- Tuple)
Transaction
1) A transaction can be defined as a group of tasks. A transaction is a very small unit of a program and it may contain several low level tasks.
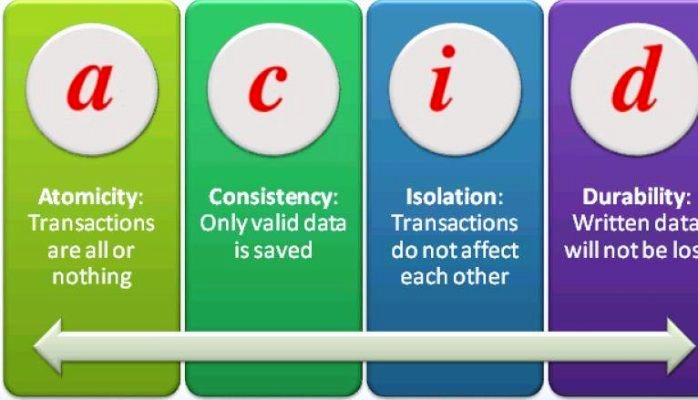
2) A transaction in a database system must maintain Atomicity, Consistency, Isolation, and Durability − commonly known as ACID properties − in order to ensure accuracy, completeness, and data integrity.
Atomicity − This property states that a transaction must be treated as an atomic unit, that is, either all of its operations are executed or none. There must be no state in a database where a transaction is left partially completed. States should be defined either before the execution of the transaction or after the execution/abortion/failure of the transaction.
Consistency −The database must remain in a consistent state after any transaction. No transaction should have any adverse effect on the data residing in the database. If the database was in a consistent state before the execution of a transaction, it must remain consistent after the execution of the transaction as well.
Isolation − In a database system where more than one transaction are being executed simultaneously and in parallel, the property of isolation states that all the transactions will be carried out and executed as if it is the only transaction in the system. No transaction will affect the existence of any other transaction.
Durability −The database should be durable enough to hold all its latest updates even if the system fails or restarts. If a transaction updates a chunk of data in a database and commits, then the database will hold the modified data. If a transaction commits but the system fails before the data could be written on to the disk, then that data will be updated once the system springs back into action.
1) A transaction can be defined as a group of tasks. A transaction is a very small unit of a program and it may contain several low level tasks.
2) A transaction in a database system must maintain Atomicity, Consistency, Isolation, and Durability − commonly known as ACID properties − in order to ensure accuracy, completeness, and data integrity.
Atomicity − This property states that a transaction must be treated as an atomic unit, that is, either all of its operations are executed or none. There must be no state in a database where a transaction is left partially completed. States should be defined either before the execution of the transaction or after the execution/abortion/failure of the transaction.
Consistency −The database must remain in a consistent state after any transaction. No transaction should have any adverse effect on the data residing in the database. If the database was in a consistent state before the execution of a transaction, it must remain consistent after the execution of the transaction as well.
Isolation − In a database system where more than one transaction are being executed simultaneously and in parallel, the property of isolation states that all the transactions will be carried out and executed as if it is the only transaction in the system. No transaction will affect the existence of any other transaction.
Durability −The database should be durable enough to hold all its latest updates even if the system fails or restarts. If a transaction updates a chunk of data in a database and commits, then the database will hold the modified data. If a transaction commits but the system fails before the data could be written on to the disk, then that data will be updated once the system springs back into action.
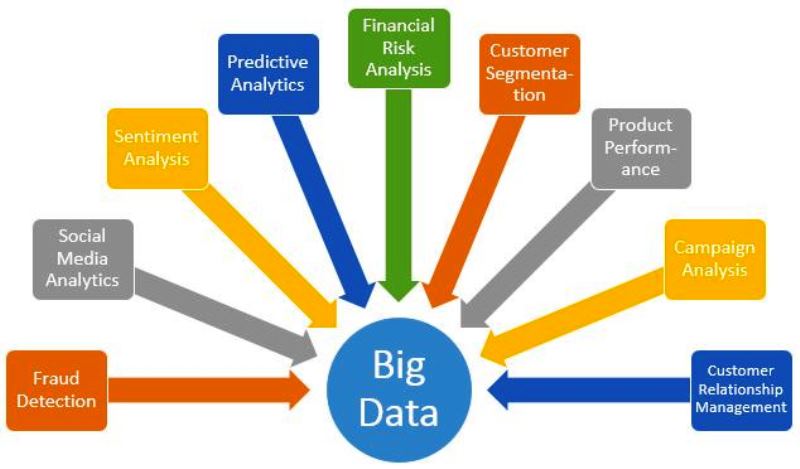
Big Data- (Unstructured Data)
Every day, we create 2.5 Quintilian bytes of data — so much that 90% of the data in the world today has been created in the last two years alone.
This data comes from everywhere: sensors used to gather climate information, posts to social media sites, digital pictures and videos, purchase transaction records, and cell phone GPS signals to name a few.
Digital Information such as audios, videos, 3D Images, Medical records, Business reports, Email, Research, and Text files.
This data is big data and mainly constitutes the unstructured data. This Big Data offers challenge in term of storage and further analysis in rest of in real time. One can dig gold mine if we are able to make sense out of big data.
6V of Big Data: Velocity, Variety, Volume, veracity, Validity, Volatility
Volume
The quantity of generated and stored data. The size of the data determines the value and potential insight- and whether it can actually be considered big data or not.
Variety
The type and nature of the data. This helps people who analyze it to effectively use the resulting insight. Structured or Unstructured data.
Velocity
In this context, the speed at which the data is generated and processed to meet the demands and challenges that lie in the path of growth and development.
Variability
Inconsistency of the data set can hamper processes to handle and manage it.
Veracity
The quality of captured data can vary greatly, affecting accurate analysis.
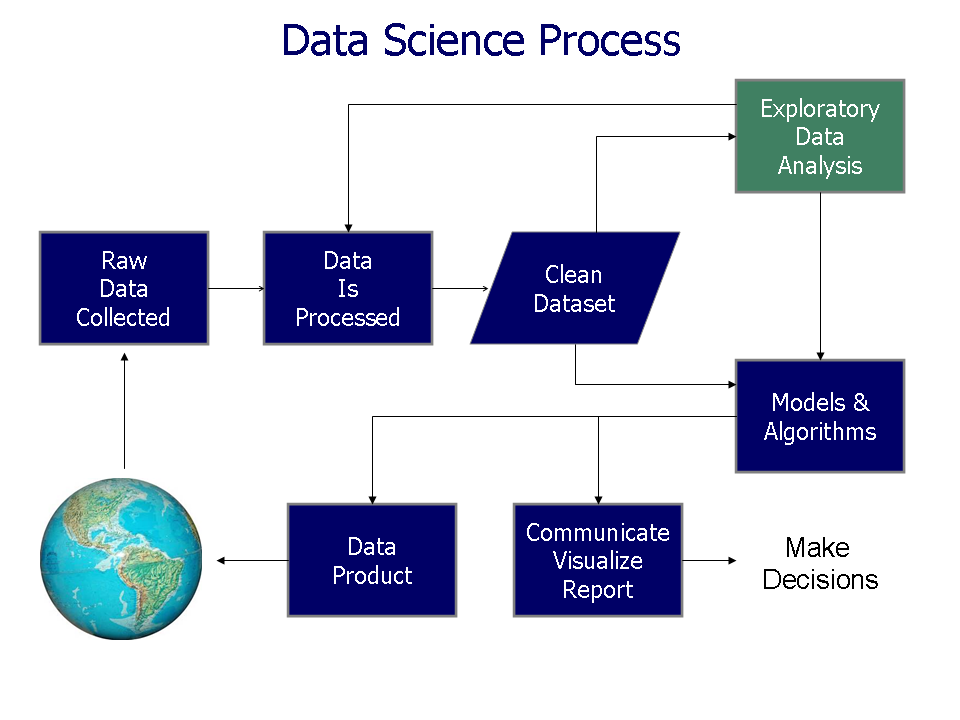
The important parts of Data Analysis are:
1) Data Mining 2) Data Warehouse/Data Collection 3) Data Model 3) Data Wrangling 5) Predictive Model 6) Data Visualization / Data Interpretation 7) Data Cleaning / Data Validation 8) Statistical Analysis
Data Mining
Data mining (sometimes called data or knowledge discovery) is the process of analyzing data from different perspectives and summarizing it into useful information - information that can be used to increase revenue, cuts costs, or both.
Data mining software is one of a number of analytical tools for analyzing data. It allows users to analyze data from many different dimensions or angles, categorize it, and summarize the relationships identified.
Technically, data mining is the process of finding correlations or patterns among dozens of fields in large relational databases. Data Mining is about pattern recognition.
Data mining consists of five major elements:
1) Extract, transform, and load transaction data onto the data warehouse system.
2) Store and manage the data in a multidimensional database system.
3) Provide data access to business analysts and information technology professionals.
4) Analyze the data by application software.
5) Present the data in a useful format, such as a graph or table.
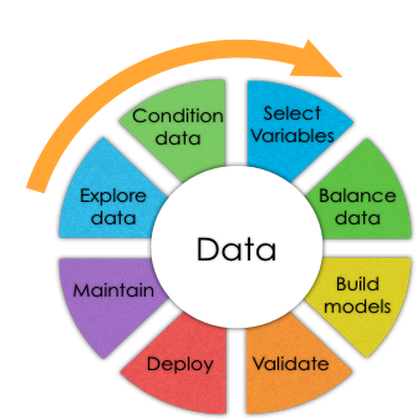
Knowledge Discovery Process:-
Data Cleaning − In this step, the noise and inconsistent data is removed.
Data Integration − In this step, multiple data sources are combined.
Data Selection − In this step, data relevant to the analysis task are retrieved from the database.
Data Transformation − In this step, data is transformed or consolidated into forms appropriate for mining by performing summary or aggregation operations.
Data Mining − In this step, intelligent methods are applied in order to extract data patterns.
Pattern Evaluation − In this step, data patterns are evaluated.
Knowledge Presentation − In this step, knowledge is represented
Information
The patterns, associations, or relationships among all this data can provide information. For example, analysis of retail point of sale transaction data can yield information on which products are selling and when.
Knowledge
Information can be converted into knowledge about historical patterns and future trends. For example, summary information on retail supermarket sales can be analyzed in light of promotional efforts to provide knowledge of consumer buying behavior. Thus, a manufacturer or retailer could determine which items are most susceptible to promotional efforts.
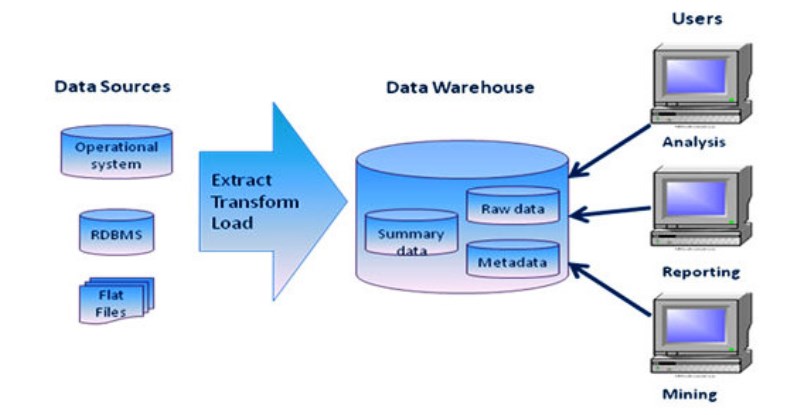
Data Warehouse
A large store of data accumulated from a wide range of sources within a company and used to guide management decisions. Data warehousing is defined as a process of centralized data management and retrieval.
Data collection
Data is collected from a variety of sources.
The data may also be collected from sensors in the environment, such as traffic cameras, satellites, recording devices, etc. It may also be obtained through interviews, downloads from online sources, or reading documentation.
OLTP (On-line Transaction Processing) is characterized by a large number of short on-line transactions (INSERT, UPDATE, DELETE). The main emphasis for OLTP systems is put on very fast query processing, maintaining data integrity in multi-access environments and an effectiveness measured by number of transactions per second. In OLTP database there is detailed and current data, and schema used to store transactional databases is the entity model (usually 3NF).
OLAP (On-line Analytical Processing) is characterized by relatively low volume of transactions. Queries are often very complex and involve aggregations. For OLAP systems a response time is an effectiveness measure. OLAP applications are widely used by Data Mining techniques. In OLAP database there is aggregated, historical data, stored in multi-dimensional schemas (usually star schema).
The following table summarizes the major differences between OLTP and OLAP system design.
OLTP System - Online Transaction Processing (Operational System)
OLAP System - Online Analytical Processing (Data Warehouse)
1) OLTP stands for On-line Transaction Processing while OLAP stands for On-line Analytical Processing.
2) OLTP provides data to data warehouse while OLAP analyze this data.
3) OLTP deals with operational data while OLAP deals with historical data.
4) In OLTP queries are simple while in OLAP queries are relatively complex.
5) Processing speed of OLTP is very fast while in OLAP processing speed depends upon the amount of data.
6) OLTP requires less space for data as compare to OLAP.
7) Database design of OLAP is highly normalized with many tables while in OLAP the database design is de-normalized with few tables.
8) In OLTP database transactions are short while in OLAP database transaction are long.
9) IN OLTP volume transactions are high while in OLAP volume transaction are low.
10) In OLAP transaction recovery is necessary while in OLTP transaction recovery is not necessary.
11) OLTP focuses on updating data while OLAP focuses on reporting and retrieval of data.
Data Wrangling
Data Wrangler is an interactive tool for data cleaning and transformation.
Spend less time formatting and more time analyzing your data.
Data cleaning / Data Validation
Once processed and organized, the data may be incomplete, contain duplicates, or contain errors. The need for data cleaning will arise from problems in the way that data is entered and stored. Data cleaning is the process of preventing and correcting these errors.
Data visualization:
The visual interpretation of complex relationships in multidimensional data. Graphics tools are used to illustrate data relationships.
Predictive Model: Predictive modeling is a process used in predictive analytics to create a statistical model of future behavior. Predictive analytics is the area of data mining concerned with forecasting probabilities and trends.

|
|
|
Statistical Analysis: Collection, examination, summarization, manipulation, and interpretation of quantitative data to discover its underlying causes, patterns, relationships, and trends
|
|
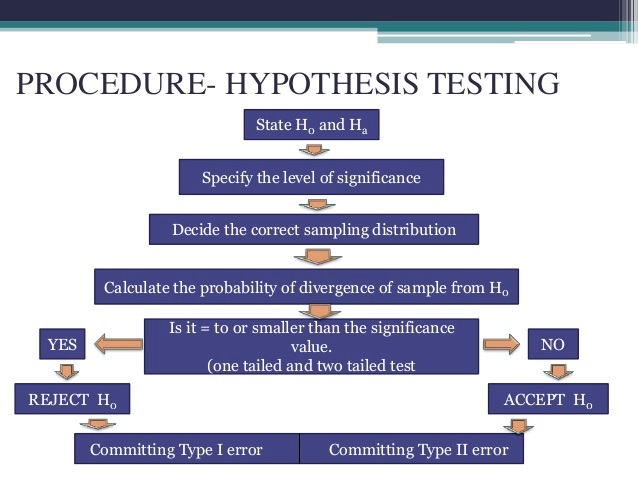
Hypothesis testing: A hypothesis test is a statistical test that is used to determine whether there is enough evidence in a sample of data to infer that a certain condition is true for the entire population.
1) Hypothesis testing: Distribution, Sampling, Probability
i) Null Hypothesis (Ho) ii) Alternative hypothesis (H1)
2) Linear Regression: Sales, price, Ads, Brand how 3 factors it influence sales
3) Logistic Regression: Predict if an event occurs, doesn’t estimate value. Bank credit check
4) Cluster Analysis: Used to find items similar to other, organizing data into groups - Recommendation
5) Factor Analysis: Groups columns similar to other, large no. of variables
Hadoop
Apache Hadoop is an open-source software framework for distributed storage and distributed processing of very large data sets on computer clusters built from commodity hardware.
The core of Apache Hadoop consists of a storage part, known as Hadoop Distributed File System (HDFS), and a processing part called MapReduce.
What is Spark
Apache Spark is an open source big data processing framework built around speed, ease of use, and sophisticated analytics.
Spark has several advantages compared to other big data and MapReduce technologies like Hadoop and Storm.
Apache Spark is an open source big data processing framework built around speed, ease of use, and sophisticated analytics.
Spark has several advantages compared to other big data and MapReduce technologies like Hadoop and Storm.
R programming language
R is a programming language and software environment for statistical computing and graphics supported by the R Foundation for Statistical Computing.
The R language is widely used among statisticians and data miners for developing statistical software and data analysis.
R is a GNU project. The source code for the R software environment is written primarily in C, Fortran, and R.
R is freely available under the GNU General Public License, and pre-compiled binary versions are provided for various operating systems.